Here we will develop some classes for interpolating general multi-linear fatigue curves using SciPy's interp1d. interp1d creates a class instance which can then be called with lookup values:
x = [ 1,2,3,...]      # X-axis values
y = [ 20,15,10,...]   # Y-axis values
f = interp1d(x,y)
y1 = f(x1)            # Query at a new value, x1
Semi-Log
Using a linear interpolation function on a semi-log graph requires that the log of the values is used on the log axis. With fatigue curve arrays of \(N\) and \(S\), interpolating for stress can be done by:
\begin{equation*}
f=\text{interp1d}(\log_{10}N, S)
\end{equation*}
\begin{equation*}
S_{new}=f(\log_{10}N_{new})
\end{equation*}
And interpolating for cycles:
\begin{equation*}
f=\text{interp1d}(S, \log_{10}N)
\end{equation*}
\begin{equation*}
N_{new}=10^{f(S_{new})}
\end{equation*}
Log-Log
Log-log calculations are the same as Semi-log but with the exception that both axes use the logarithm of the values.
To obtain stress:
\begin{equation*}
f=\text{interp1d}(\log_{10}N, \log_{10}S)
\end{equation*}
\begin{equation*}
S_{new}=10^{f(\log_{10}N_{new})}
\end{equation*}
To obtain cycles:
\begin{equation*}
f=\text{interp1d}(\log_{10}S, \log_{10}N)
\end{equation*}
\begin{equation*}
N_{new}=10^{f(\log_{10}S_{new})}
\end{equation*}
Implementation
In Python we can implement the above as classes. First a general class common to both log-log and semi-log:
import numpy as np
import matplotlib.pyplot as plt
from scipy.interpolate import interp1d

class FatigueCurve:
    ''' Base class for a fatigue curve.

        Parameters
        ----------
        points : list
            A list containing (N,S) data point pairs (2+)

    '''
    def __init__(self,points):
        self.N, self.S = list(zip(*points))
        self.N = np.asarray(self.N)
        self.S = np.asarray(self.S)
        self.logN = np.log10(self.N)
        self.logS = np.log10(self.S)

    def _plot(self):
        ''' Plot setup method '''
        fig, ax = plt.subplots()
        ax.set_xlabel('Cycles')
        ax.set_ylabel('Stress')
        ax.grid(True, which='both', axis='both', color='lightgrey')
        return fig, ax
Next we create classes for semi-log and log-log:
class SemiLogCurve(FatigueCurve):
    def __init__(self,points):
        super().__init__(points)
        self.getS_f = interp1d(self.logN,self.S)
        self.getN_f = interp1d(self.S,self.logN)

    def _semilogx(self,ax,N,S):
        ''' Plot an interpolated value on a semilog fatigue curve. '''
        ax.semilogx(self.N,self.S,markersize=6,marker='o')
        ax.semilogx(N,S,markersize=6,marker='o')
        ax.annotate('({:,.2}, {:,.2})'.format(N,S), (N,S))
        return ax

    def getS(self,N,plot=False):
        ''' Interpolate stress from cycles. '''
        S = self.getS_f(np.log10(N))
        if plot:
            fig,ax = self._plot()
            ax = self._semilogx(ax,float(N),float(S))
        return int(S)

    def getN(self,S,plot=False):
        ''' Interpolate cycles from stress. '''
        N = np.power(10,self.getN_f(S))
        if plot:
            fig,ax = self._plot()
            ax = self._semilogx(ax,float(N),float(S))
        return int(N)

    def plot(self):
        fig, ax = self._plot()
        ax.semilogx(self.N,self.S)

    __call__ = getS


class LogLogCurve(FatigueCurve):
    def __init__(self,points):
        super().__init__(points)
        self.getS_f = interp1d(self.logN,self.logS)
        self.getN_f = interp1d(self.logS,self.logN)

    def _loglog(self,ax,N,S):
        ''' Plot an interpolated value on a log-log fatigue curve. '''
        ax.loglog(self.N,self.S,marker='o',markersize=6)
        ax.loglog(N,S,marker='o',markersize=6)
        ax.annotate('({:,.2}, {:,.2})'.format(N,S), (N,S))
        return ax

    def getS(self,N,plot=False):
        ''' Interpolate stress from cycles '''
        S = np.power(10,self.getS_f(np.log10(N)))
        if plot:
            fig,ax = self._plot()
            ax = self._loglog(ax,float(N),float(S))
        return int(S)

    def getN(self,S,plot=False):
        ''' Interpolate cycles from stress '''
        N = np.power(10,self.getN_f(np.log10(S)))
        if plot:
            fig,ax = self._plot()
            ax = self._loglog(ax,float(N),float(S))
        return int(N)

    def plot(self):
        fig, ax = self._plot()
        ax.loglog(self.N,self.S)

    __call__ = getS
Usage
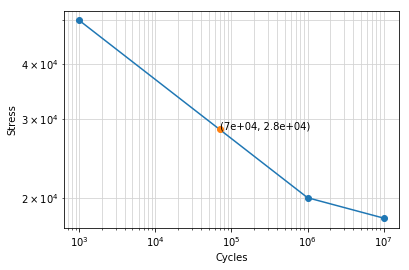
>>> curve = LogLogCurve([(1e3,50e3),(1e6,20e3),(1e7,18e3)])
>>> curve.getS(70e3,plot=True)
28459
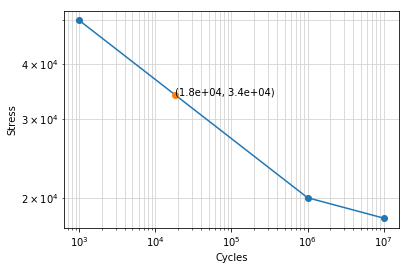
>>> curve.getN(34e3,plot=True)
18309